This article describes some of the top insurance fraud schemes from 2020 that could have been detected by algorithm.
New Orleans Staged Truck Accidents
This fraud involved a very large group of criminals who purposely collided vehicles into semi-trailer trucks to sue for personal injuries. It is an amazing demonstration of the level of danger some fraudsters are willing to tolerate to earn a payday. One of the participants of the scheme decided to change sides and testify against the fraud ring. He was assassinated. Here is another account, another, and another.
Our algorithms work differently than most of our competitors. We have proprietary techniques that are looking for nonrandom behaviors. If our datasets contain enough of these fraudulent claims, we pick up the non-random effect and flag the claims for SIU teams to investigate. When the pattern is identified, we immediately flag subsequent claims fitting the profile so that the SIU team can begin surveillance.
Typically a ring like this, gets into a ‘rhythm’ of how they commit the fraud and it is these non-random patterns that our algorithms detect. These can involve a particular time of the week, location, set of doctors, set of lawyers, pattern of medical bills, etc. that are detectable to our algorithms. In this specific instance, the the location of the accidents is the key. The fraudsters chose a specific jurisdiction (New Orleans) where they felt that investigators and legal authorities would not catch them. Non-random factors such as the jurisdiction of these accidents are what our algorithms are designed to catch.
NFL Players Overbilled Insurance Companies
In this case, eight former NFL players were involved in submitting fake medical records. Ninety-two claims were submitted, asking for reimbursements totaling $723,826. You can read about it here.
This fraud ring is a great example of the type of fraud that our algorithms detect, as it highlights common behavior associated with medical bill fraud. While this case involved large sums of money with high profile “patients,” personal injury protection fraud schemes more commonly involve a very large number of smaller-value claims (each totaling $10,000 or less, for example).
What typically happens is a medical provider, working with “patients”, bills insurance companies for medical “treatment” that did not occur. In this particular former NFL case the “patients” were a poor choice for the fraud ring because they were high profile and high dollar and thus more likely to attract the attention of human medical reviewers.
What is less detectable, and more common, is for medical providers to recruit low profile individuals and submit small nuisance claims. Insurance company executives often believe that these small claims do not add up to large dollar amounts.
For a time, when I was the president of the 10th largest auto insurer in Florida, I believed these small claims were just a nuisance and a part of doing business, not realizing how frequent they were and how many dollars were siphoned off in this manner.
Fraudspotters has sophisticated algorithms that read all the medical bills, profiling the pattern of CPT codes used. Fraudsters often rely on the fact that insurance company executives are not willing to pay doctors to review every small nuisance claim. Indeed many executives feel they are making a good business decision to quickly settle these claims, not realizing that fraudsters may be behind hundreds of similar claims directed precisely at them! In fact, many insurance companies establish “fast track” payment methods whereby if certain claims meet the criteria, the claims bypass human review. Once a fraudster realizes which types of claims are fast tracked, they submit the same type of claim many times over. The individual reviewers who are just following “check box” routines for the fast track do not realize this is occurring, but our algorithms can. Unfortunately, insurance company executives often think they are following best practice by using services from our competitors who are “pinging” the patients against a database to see if they were involved in past fraud. If the “patients” are not detected in these fraud databases, and the claim is small and uncomplicated, the claim is fast tracked for review. Basically, all the fraud rings need to do is find people who are not already in insurance company fraud databases and fabricate small claims.
As I said above, this fraud ring was too high profile to avoid human inspection, but other rings are siphoning off billions of dollars undetected, essentially employing the playbook of this former NFL player fraud scheme but with lower profile claims.
Hudson “Runner”
Although not occurring in 2020, Luis Aguirre, the Hudson “Runner”, was sentenced in 2020. And, this situation serves to continue the narrative I established above with the NFL case about recurring medical fraud. This is exactly the type of scheme that insurance company executives do not realize is occurring and are in fact enabling with “fast track” payments for small claims where the claimant is not found in an insurance fraud database. This conspiracy took small claims which, while individually very small, added up to $3.5m.
I know for a fact that there are presently similar fraud schemes ongoing in South Florida. I know who is doing it and how to detect it. Ironically, there are even former Insurance SIU people who have created fake clinics to take advantage of the fast-track protocols.
Adjuster and Medical Provider Rack up $1.6m in Workers Compensation
In this scheme, an employee working for the company took advantage of the fast-track authority to continuously process small claims over a twelve year period, totaling $1.6m. This activity would have been very easy for our algorithms to detect. This is a classic scheme, and we have a specific algorithm exactly for this situation.
It is ironic that some insurance executives (such as I was myself) probably believe they are making good business decisions to fast track these claims, for a time I believed this too. But, what these executives need to do is run their claims through algorithms, such as ours, to screen for these patterns. This article is worth a read, and so is this one.
In an effort for transparency, I created this page to write about questions that are asked of me, and my response.
Didn’t Georgia already audit the machines?
They did some sort of audit. But, people dispute these audits are effective. For example, while these type of videos are making their way around the web, a significant portion of society will doubt the results of Georgia’s audit. My link is to a Trump tweet so you can see that Trump is pushing this himself, and this information is widely seen. I’m not trying to make a partisan statement by linking to Trump.
Here is a video of the same man succinctly explaining why he believes the Georgia recount was not valid.
Isn’t this just a partisan issue?
No. All sides believe in the importance of election integrity. For example, the NY Times, which is considered center or left, depending on your point of view, but not right, had this to say about Dominion in June of 2020.
Are there really enough machines in Wisconsin to have changed the outcome there?
If you go to verifiedvoting.org, and selection Dominion, 2020, Wisconsin, and download the data, you’ll see that they are saying 527 precincts, 640,215 registered voters are on Dominion machines. The state only has a 20k vote difference among Biden and Trump. And, in my paper, the Dominion effect was calculated on a county basis, not precinct basis. To the extent counties are split on which machine they used, then my paper is underestimating the Dominion effect: the effect is likely bigger on a precinct by precinct basis; I don’t have the data to go to that detail.
But to answer the question: yes, based on published, public information, there are enough machines to change the election in Wisconsin.
Why don’t you show results for 2012 and 2016?
I did a fair amount of analysis on those election cycles with mixed results. It is challenging to tease out the effects. For example, suppose Dominion is deployed in 2012. Does it increase vote counts for Democrats in 2012, 2016 and 2020? Does it make the counts go up an additional increment each year? Are there years where the Dominion Effect is not in effect, so to speak, and the votes regress to what they should have been? It becomes harder to form a clear hypothesis when we mix the years. The hypothesis I posit in the paper is clear. I only test counties that had no Dominion in 2008 (by excluding New York) versus counties in 2020 that either did or did not have Dominion by that time.
Is it possible that there are pre-trends that can explain this result?
As I mentioned in the main article. I find the multivariable weighted least squares to be the most convincing. The reason for this is because the factor for Dominion by itself, when not controlled, does have pre-trends.
However, when using a weighted multivariate analysis, there is no pre-trend associated with the Dominion counties.
If you wish to see the two spreadsheets associated with this analysis, click here and here. If you wish to access a CSV file, click here.
If you wish to see how the data was constructed, click here here
.
Are you sure that “Dominion” isn’t just a proxy for “Democratic Voter”?
We can test for this. The easiest way to test is to remove the Dominion flag for the 657 counties that have Dominion, and replace it with a flag for the top 657 most Democratic counties. This is performing the test assuming that a voting machine company had been adopted by the 657 most Democratic counties. Let’s call this company “MachinesForDems”. The model says that the “MachinesForDems Effect” is not the same as the Dominion Effect. The coefficient for “MachinesForDems” in the weighted model is -0.22% (not positive) and the two p–values are 0.07% (traditional) and 68.04% (robust–not significant).
We can do further tests by creating another flag, “MachinesForReps” which is the top 657 most Republican leaning counties. We can put all three flags into the model, Dominion, MachinesForDems, and MachinesForReps. Interestingly the “MachinesForReps” IS significant, and can be used as a control variable, but it doesn’t affect the significance of Dominion. Dominion’s coefficient for the weighted model is 1.56% and its p-values are 0.00% (traditional) and 0.09% (robust).
If you would like to see how I created this data, click here.
If you would like to see a spreadsheet with this analysis, click here .
Have you really accounted for very large and very small counties?
In our model, we are already using these adjustments:
weighting by county size
a field called “RuralUrbanContinuumCode2013”
These should adjust for county size, but in effort to address concerns of readers, I ran the model with two new flags:
657 counties with highest number of voters in 2008
657 counties with lowest number of voters in 2008
The Dominion Effect is still 1.55% and the p-values are 0.00% (traditional) 0.09% (robust). These p-values are suggesting less than 1 in 1000 chance of randomly occurring.
To further address this, I ran an additional model which also includes a field for the population per square mile. This model produces identical results of Dominion Effect of 1.55% and a p-value of 0.00% and 0.09%.
What about race? Why don’t you adjust for that?
We can do that too. To the model in the prior FAQ, I add a flag for the 657 counties that have the highest percentage of white-non-hispanic and another flag for the highest black-non-hispanic residences. This is as if a voting company somehow either got assigned to the highest percentage white or highest percentage black counties.
The Dominion Effect becomes 1.56% and the p-values are 0.00% and 0.15%.
Why don’t you adjust for age?
We can do that too. To the model used in the above FAQs, we can add a flag for the 657 counties with the highest percentage of residents over age 65 at the year 2010. At this point, I’d like to show the results of this enormous weighted-least squares.
Multiple Linear Regression: Weighted Least Squares, Two types of P-values
Variable
Coefficient
P-value
P-value Consistent
Intercept
-7.51%
0.00%
0.00%
RuralUrbanContinuumCode2013
-0.31%
0.00%
0.28%
ManufacturingDependent2000
-2.71%
0.00%
0.00%
HiAmenity
0.23%
23.48%
65.86%
HiCreativeClass2000
5.29%
0.00%
0.00%
Low_Education_2015_update
2.27%
0.00%
0.00%
PopChangeRate1019
0.17%
1.77%
0.00%
Net_International_Migration _Rate_2010_2019
0.14%
0.10%
55.07%
PopulationDensity
0.00%
88.32%
96.33%
LargePopCountiesTop657
2.06%
0.00%
0.00%
SmallPopCountiesTop657
0.25%
74.12%
56.44%
HighDemPerTop657
-0.60%
0.22%
23.64%
HighRepPerTop657
1.59%
0.00%
0.01%
OverAge65PercentTop657
-3.84%
0.00%
0.00%
WhiteNonHispanicTop657
-4.58%
0.00%
0.00%
BlackNonHispanicTop657
1.49%
0.00%
0.24%
Dominion
1.42%
0.00%
0.24%
This does slightly effect the Dominion Effect. It shrinks to 1.42% (a value that doesn’t change any conclusions in the main article) and the p-value remains significant at 0.00% (traditional) and 0.24% (robust).
If you would like to see an Excel workbook with this data and analysis, click here.
It should be noted, that if you run enough models, inevitable some will produce higher coefficients and some will produce lower coefficients, but the important fact here is that the coefficient remains in the 1.0 to 1.6% range discussed in the article and the p-value remains significant.
Why don’t you focus in changes in demographic trends over time?
We can do that too.
Multiple Linear Regression: Weighted Least Squares, Two types of P-values
Variable
Coefficient
P-value
P-value Consistent
Intercept
-6.6%
0.00%
0.00%
NetMigrationRate0010
-0.1%
0.00%
0.00%
NetMigrationRate1019
0.3%
0.00%
0.00%
NaturalChangeRate0010
0.5%
0.00%
0.10%
NaturalChangeRate1019
0.3%
0.10%
11.20%
Immigration_Rate_2000_2010
0.2%
0.00%
10.10%
Net_International_Migration_Rate_2010_2019
0.3%
0.00%
32.00%
UnemployRate2007-UnEmployRate2019
-1.0%
0.00%
0.00%
Dominion
1.7%
0.00%
0.00%
What does the above model look like if you add basic demographic info?
Like this:
Multiple Linear Regression: Weighted Least Squares, Two types of P-values
Variable
Coefficient
P-value
P-value Consistent
Intercept
2.9%
1.10%
22.70%
NetMigrationRate0010
-0.1%
0.00%
0.20%
NetMigrationRate1019
0.3%
0.00%
0.00%
NaturalChangeRate0010
0.7%
0.00%
0.00%
NaturalChangeRate1019
-0.1%
39.10%
65.40%
Immigration_Rate_2000_2010
0.3%
0.00%
7.40%
Net_International_Migration_Rate_2010_2019
0.0%
88.80%
96.90%
UnemployRate2007-UnEmployRate2019
-1.1%
0.00%
0.00%
PopDensity2010
0.0%
0.00%
25.70%
Under18Pct2010
-0.3%
0.00%
0.80%
Age65AndOlderPct2010
-0.3%
0.00%
0.00%
WhiteNonHispanicPct2010
0.0%
39.40%
71.20%
BlackNonHispanicPct2010
0.1%
0.00%
0.00%
Dominion
1.5%
0.00%
0.40%
Why don’t you test other machines?
Honestly, I was tired of working on this project and did not have flags for the other machines. However, someone who read this blog obtained flags, and I added them to the data. To the model shown in the above FAQ, I tested the various machines. Note, this was several different models, each testing the machines one at a time. When I put all of the machines at the same time into the model I encounter fitting problems.
Here are the results. Note each line is from its own model run. Dominion is the only significant machine. The Dominion “other” line is for “Sequoia (Dominion)” and “Premier/Diebold (Dominion)” machines. These machines are the most significant. Note that “20” indicates that the machine was used in 2020. For 2008, any machine could have been used, and it is too complicated to account for each permutation.
Multiple Linear Regression: Weighted Least Squares, Two types of P-values
Variable
Coefficient
P-value
P-value Consistent
Democracy.Live-20
0.1%
56.8%
80.7%
Dominion.other-20
3.0%
0.0%
0.0%
Dominion.Voting.Systems-20
1.5%
0.0%
0.3%
Election.Systems…Software-20
0.3%
16.6%
49.1%
Hart.InterCivic-20
0.0%
98.4%
99.2%
Other-20
-0.1%
74.6%
89.3%
If you wish to obtain an Excel workbook which shows how the above results were calculated, along with the results for the prior two FAQs, click here.
What other variables should we evaluate?
I recently reran this model against about 100 demographic variables. As noted above, some produce larger coefficients and others produce smaller. One issue I run into is that if you add enough variables, at some point the demographic variables start to be too correlated with each other and we have problems with multicollinearity. From a practical point of view what is occurring is many variables are describing the same thing and are overfitting. The most easy example to explain is the situation of a very largely populated county. From a demographic point of view, these counties simultaneously have large groups of very educated people and also large groups of very uneducated people. They also have very high income people and very low income people. They also have a high percentage of very young people. So, if you put the variables of size of county, high education, low education, high income, low income, and very young people in the same models, these variables are competing with each other to flag the very large cities. This can cause overfit issues and multicollinearity issues which can render the models less reliable. I think the best thing for me to say about this is it appears that the Dominion Effect, if real is somewhere between 1.0% and 1.6%. The p-values are typically significant. Only a full forensic audit would reveal the true nature of the situation.
Are you sure the model isn’t just picking up state specific effects?
Someone suggested that I delete all states except for states that are split with some counties having Dominion and other counties in the state not using Dominion. These split states are: Arizona, California, Colorado, Florida, Illinois, Iowa, Kansas, Massachusetts, Michigan, Minnesota, Missouri, Nevada, New Jersey, Ohio, Pennsylvania, Tennessee, Virginia, Washington, and Wisconsin.
Using the original model, and only including these split states, the Dominion Effect in the weighted model is 1.54%. The power of the model is diminished slightly with so many fewer counties. The p-values for the weighted model are 0.00% (traditional) and 1.20% (robust).
This suggests that when we run the model only on split county states, the Dominion Effect remains.
If you would like to see an excel workbook with this analysis, click here .
If you would like to see how the voting size and partisan share fields are created, click here.
In your analysis, if you remove Georgia, the Dominion Effect is greatly diminished? Doesn’t this invalidate your work?
Not really. The results are still valid. They Dominion coefficient using unweighted values is 0.43% with p-values 14.63% (traditional) and 12.74% (robust) and for weighted values they are 0.96% with p-values of 0.00% (traditional) and 6.05% (robust). I believe this is indicating that Georgia is the strongest case for auditing. Because the unweighted coefficients become much lower without Georgia, to me this is saying that Georgia is a prime candidate for testing small counties; the Dominion effect is likely strong there. Because the coefficient stays relatively high for weighted, it seems to say that the “Dominion Effect” is stronger in big cities outside of Georgia but not as strong in small counties. Click here for an excel workbook showing results without Georgia.
I am doing heavy analysis and encountering modeling errors? Is there a problem with the data?
Yes. Many people have analyzed the data and one valid criticism has occurred. There are five data points that have incorrect demographic data. If you do heavy demographic modeling, I recommend you remove these five data points: “Baltimore city”, “Saint Louis”, “St. Louis city”, “Carson City”, “Dona Ana”.
Why are there older versions of this article on the web?
I wrote and updated this article by posting it on the web and sharing it with other statistical analysts. I did this prior to allowing it to be shared on social media. There were actually four different versions of this analysis. Version 3 had a data error in the denominator of the Y variable which over-emphasized the coefficients. A reviewer caught that, and it was fixed before this article was widely shared on social media. If you come across older cached versions of this article, just know they were pre-release drafts.
Furthermore, upon recently reviewing about 100 demographic variables, I think it is safer to say the Dominion Effect is somewhere between 1.0% and 1.6% instead of just saying 1.5%.
What are the biggest challenges to your model?
I have disclosed the biggest challenges in the FAQ above. I think the biggest issue is people wonder if I have proven causality. All I can say is, I am attempting to address any concerns people have about that in the FAQ above. It is very possible that some third factor is causing the results we are seeing, and it is not the Dominion machines. I have attempted to mitigate these concerns by controlling for other factors and disclosing pre-trend issues. My main point is, I’ve shown plausible data. Why resist audits that prove to the world there is nothing to see here?
Statistical analysis of past presidential races supports the view that in 2020, in counties where Dominion Machines were deployed, the voting outcomes were on average (nationwide) approximately 1.5% higher for Joe Biden and 1.5% lower for Donald Trump after adjusting for other demographic and past voting preferences. Upon running hundreds of models, I would say the national average effect appears to be somewhere between 1.0% and 1.6%.
For Dominion to have switched the election from Trump to Biden, it would have had to have increased Biden outcomes (with a corresponding reduction in Trump outcomes) by 0.3% in Georgia, 0.6% in Arizona, 2.1% in Wisconsin, and 2.5% in Nevada. The apparent average “Dominion Effect” is greater than the margin in Arizona and Georgia, and close to the margin for Wisconsin and Nevada. It is not hard to picture a scenario where the actual effect in Wisconsin and Nevada was greater than the national average and would have changed the current reported outcome in those two states.
Assuming the “Dominion Effect” is real, it is possible that an audit of these machines would overturn the election.
These results are scientifically valid and typically have a p-value of less than 1%, meaning the chances of this math occurring randomly are less than 1 in 100. This article, and its FAQ, shows many ways to model the “Dominion Effect.” In addition to the FAQ, I wrote a highly technical third article where millions of regressions are analyzed which further confirms the article you are currently reading.
The best way to restore faith in the system is to audit the Dominion voting machines in Arizona, Georgia, Nevada, and Wisconsin.
Study Design
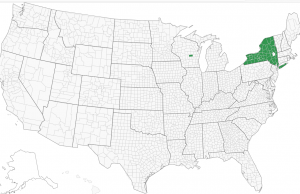
In 2008, although Dominion was in many counties in New York and had an insignificant presence in Wisconsin, it had no presence in the rest of the USA.
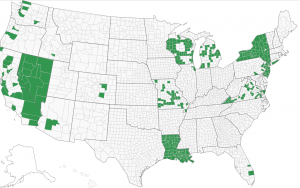
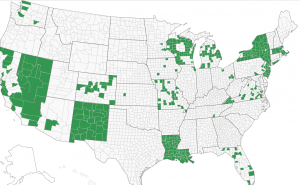
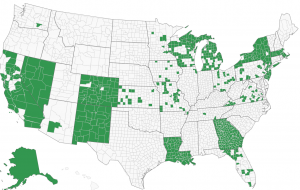
Dominion built up its presence in 2012, increased it in 2016, and increased it further in 2020.
The following images, taken from verifiedvoting.org, show the build up from a geographic perspective.
Dominion Voting Machines 2008
Dominion Voting Machines 2012
Dominion Voting Machines 2016
Dominion Voting Machines 2020
We wish to know if Dominion affects elections so we will test election results from 2008, when Dominion was not present, against 2020 when Dominion was fully present and alleged to have committed fraud. We will exclude New York from this analysis because Dominion already had a presence there in 2008. We also will exclude Alaska for lack of county specific data.
Our study is as follows:
Null hypothesis: Dominion machines are not associated with change in voter outcomes
Alternative hypothesis: The presence of Dominion machines affects election outcomes.
To do this study, we will link results from 2008 to 2020 by each county, parish, or in some cases city. Since this is usually based on county, we will refer to it as county in this article.
By comparing the county to itself, we are constructing the test similar to how a drug company would test the effects of its proposed therapy. In this case, we have 3,050 counties that do not have Dominion in 2008. In 2020, 657 of the counties have Dominion while 2,388 do not. If we assume that the same societal forces are acting upon all of these counties equally, then in comparing the average change from 2008 to 2020 for Dominion counties versus non Dominion counties, we should have a similar change in voter share. In this regard, it is as if Dominion is the proposed treatment, and non-Dominion is the placebo.
When doing this analysis, we do NOT see a change that is constant across counties. In fact, below are the results comparing 2008 to 2020. A verbal description is “the average US county’s percentage of vote for the Democrat presidential candidate was 8.4 percentage points less Democrat in 2020 (Biden vs. Trump) than in 2008. (Obama vs. McCain). However, despite this 8.4%-point decrease, Dominion counties only decreased 6.4% points, while the non-Dominion counties decreased 9.0% points.”
Dominion Counties vs. Non-dominion Counties
Dominion
Number of Counties
Average of Difference
No
2,393
-9.0%
Yes
657
-6.4%
Total
3,050
-8.4%
Incidentally, you may be surprised that the country trended Republican as a whole. This is not surprising when you realize that we are comparing the outcome of Obama vs. McCain which was not close vs the Biden vs. Trump election which is closer.
You can verify this yourself by running an ordinary least squares against this dataset.
A pure academician would say, “You are not correcting for heteroscedasticity. Unless you account for this, the results are not valid.” (For purposes of this article, heteroscedasticity is when the error of our model varies by the size of the county.) However, we can correct for this by applying heteroscedasticity-consistent standard errors. By applying this technique, we obtain the following significant results.
Simple Linear Regression: Ordinary Least Squares, Two types of P-values
Variable
Coefficient
P-value
P-value Consistent
Intercept
-8.98%
0.000%
0.000%
Dominion
2.55%
0.000%
0.000%
A pure academician would now say, “You are treating each county the same regardless of its size. You are treating a large place like L.A. County the same as a very thinly populated county.”
We can also correct for this. We can weight each observation by the total number of Republican and Democratic presidential combined votes for 2008 and 2020. Statistically, we will apply the weighted least squares technique.
Furthermore, in addition to using the standard approach, we can use heteroscedastic-consistent error term estimation like we did above. Doing this yields the following results. (You’ll notice that the p-value for Dominion using the weighted-least squares and heteroskedastic consistent approach is 0.26%. This means that this technique gives a 0.26 out of 100 chance that this occurred randomly, which is still considered “statistically significant.”)
Simple Linear Regression: Weighted Least Squares, Two types of P-values
Variable
Coefficient
P-value
P-value Consistent
Intercept
-1.72%
0.00%
0.00%
Dominion
1.96%
0.00%
0.26%
This analysis can be seen in an Excel workbook here.
Alternatively, this analysis can be performed in R using this R code and CSV file.
If you would like to verify the data, the assembling of the data can be seen in this sheet.
Does this prove Dominion is associated with changing election outcomes? No. For example, it could simply mean that the counties adopting Dominion corresponded to counties that were trending less Republican anyway; their lack of trending Republican is statistically significant, independent of Dominion. In fact, I believe this is true, but after controlling for other variables we can eliminate this issue.
Can we control for other factors?
Unlike a drug company’s test of a new treatment, our counties were not randomly selected to be “treated” by Dominion. These counties chose to install Dominion. Was there selection bias? We should control for other factors to see if the presence of Dominion still significantly affects results.
We can obtain demographic data on a county level basis from the U.S. department of agriculture. By attaching this data on a county basis to our already existing dataset, and running multiple linear regression, we obtain the following results. You’ll notice that Dominion’s p-value became more significant as we controlled for other variables. In some cases Dominion is more significant than the control variables.
Multiple Linear Regression: Ordinary Least Squares, Two types of P-values
Variable
Coefficient
P-value
P-value Consistent
Intercept
-8.93%
0.00%
0.00%
RuralUrbanContinuumCode2013
-0.52%
0.00%
0.00%
ManufacturingDependent2000
-1.02%
0.00%
0.00%
HiAmenity
1.92%
0.00%
0.00%
HiCreativeClass2000
6.67%
0.00%
0.00%
Low_Education_2015_update
2.41%
0.00%
0.00%
PopChangeRate1019
0.09%
0.00%
0.00%
Net_International_Migration_Rate _2010_2019
0.53%
0.00%
0.00%
Dominion
1.65%
0.00%
0.00%
Multiple Linear Regression: Weighted Least Squares, Two types of P-values
Variable
Coefficient
P-value
P-value Consistent
Intercept
-5.36%
0.00%
0.00%
RuralUrbanContinuumCode2013
-0.83%
0.00%
0.00%
ManufacturingDependent2000
-2.69%
0.00%
0.00%
HiAmenity
-0.51%
0.00%
27.41%
HiCreativeClass2000
5.74%
0.00%
0.00%
Low_Education_2015_update
3.00%
0.00%
0.00%
PopChangeRate1019
0.19%
0.23%
0.00%
Net_International_Migration_Rate _2010_2019
0.18%
0.34%
29.70%
Dominion
1.55%
0.00%
0.11%
To provide a basic interpretation, look at the sign of the coefficient. It is telling you whether the demographic factor increased or decreased Democratic presidential voter percentage. So, from 2008 to 2020:
The more rural, the less the Democratic share
The more manufacturing dependent, the less the Democratic share
The more a county is considered a “high natural amenity,” the more the Democratic share if we consider counties equally weighted but not if we give larger counties more weight. Note this variable has a less significant p-value than some of the others.
The more a county is considered “high creative class,” the more the Democratic share
The more a county is considered “low education,” the more the Democratic share
The more the population increased, the more the Democratic share
The more international immigration, the more the Democratic share, although one measure had this value with a questionable p-value.
And most importantly, if Dominion was installed, there was approximately a 1.5%-point increase in Democratic share which also corresponds to a 1.5%-point Republican decrease, so a total swing of 3% points.
If you wish to see this work in Excel, please download this excel file.
If you wish to verify in R, please run this R code.
If you believe specific variables should be tested, maybe we already did. Please see the FAQ. Of note, since publishing this article, we have done many more models. Most of them show the Dominion coefficient to be above 1.5% and p-values that are below 1%. One model shows the Dominion coefficient at 1.42%, and I put that particular model’s entire results in the FAQ. If you run hundreds of models, there is a range of estimated Dominion Effects that are typically between 1.0% and 1.6%.
If the “Dominion Effect” is real, would it have affected the election?
This article showed a range of estimates for the “Dominion Effect,” the more persuasive being from the multiple linear regression analysis:
Multiple Linear Regress: Ordinary Least Squares: 1.65%
Multiple Linear Regress: Weighted Least Squares: 1.55%
I find the weighted least square model the most persuasive and refer to it often in the FAQ.
If there is a Dominion Effect, it adds that percentage to Democrat presidential vote and subtracts from Republican. If the Dominion Effect is real, it may have affected this close election. For Dominion to have switched the election from Trump to Biden, it would have had to increase Democratic presidential outcomes by 0.3% and reduced Republican outcomes by 0.3% in Georgia. The factors for the other states are 0.6% in Arizona, 2.1% in Wisconsin, and 2.5% in Nevada. Click here to see the math.
If you believe the Dominion Effect is real, it is not hard to believe that this effect would be greater in swing states and could have swung these four states into Biden’s column, putting the electoral college in his favor.
What does this mean?
It means that Arizona, Georgia, Nevada, and Wisconsin should allow the Republicans to audit the machines.
Let me pose these questions to the following individuals/entities:
Future President Joe Biden: Do you want a significant portion of the population to believe your presidency was only won through Dominion voting systems?
Dominion Corporation: Do you want a significant portion of the population to distrust you and demand that your machines are not used?
Arizona, Georgia, Nevada, and Wisconsin election officials: Do you want a significant portion of your constituents to believe you are part of a conspiracy?
Transparency is the key to solving this. Although there will always be a fringe group that will never believe the results of such an audit, why not prove them wrong? They are already alleging fraud and doing it in such a way that a significant portion of society already knows about it. Here is a good example from comedian JP Sears: this information is making its way through society.
And I just showed you statistics that will be used to allege conspiracy.
If you think ignoring this will make it go away, I believe you are mistaken.
Do we want another four years where one side of the political divide continually argues that the election was not valid? Will that help our society?
How should we talk about this?
Feel free to use this data and analysis as you see fit. If you find that I did something wrong, please politely tell me, and I’ll gladly update my post.
I do not wish to be a part of any sort of misinformation, which is why I am being fully transparent in showing my data sources, methods, and identity. I wish to have cordial dialogue with those who disagree. Please note, I have a FAQ page to respond to questions about this analysis. It is always possible for statistical models to show something different than what one thinks they are showing, and I can readily admit that. If my analysis and/or data have issues, I want to know about it and I want to correct this post.
We are all fellow citizens, and I recommend we become united in our effort to support transparency as it pertains to democracy.
I recommend we audit the machines.
Author Biography
Ben Turner has spent most of his career as an actuary in the insurance industry. From 2006 to 2016 he was with Texas Mutual, serving the last several years as SVP and Chief Actuary. In 2016 he accepted a position at Windhaven, working as the president to help a struggling insurance company. Although unable to prevent the company from going into run-off, his experience required a deep dive into the fraud industry that caused Windhaven’s demise. Since then, Ben has dedicated his career to understanding the mathematics of fraud. In 2020, Ben Turner created FraudSpotters, a company providing software for insurance companies to help them identify fraud rings. In addition to his experience, he is a member of the American Academy of Actuaries, an Associate in the Casualty Actuarial Society, an inactive member of the California bar, a graduate of the BYU MBA program, and a graduate of BYU law school.
I decided I should substantiate or disprove what I was hearing. My goal was to write an article either showing “nothing to see here” or explaining why more auditing/investigation should occur.
I recommend we audit the machines.
By the way, if you have read this far, there is more interesting work shown at the FAQ. I recommend you check it out.